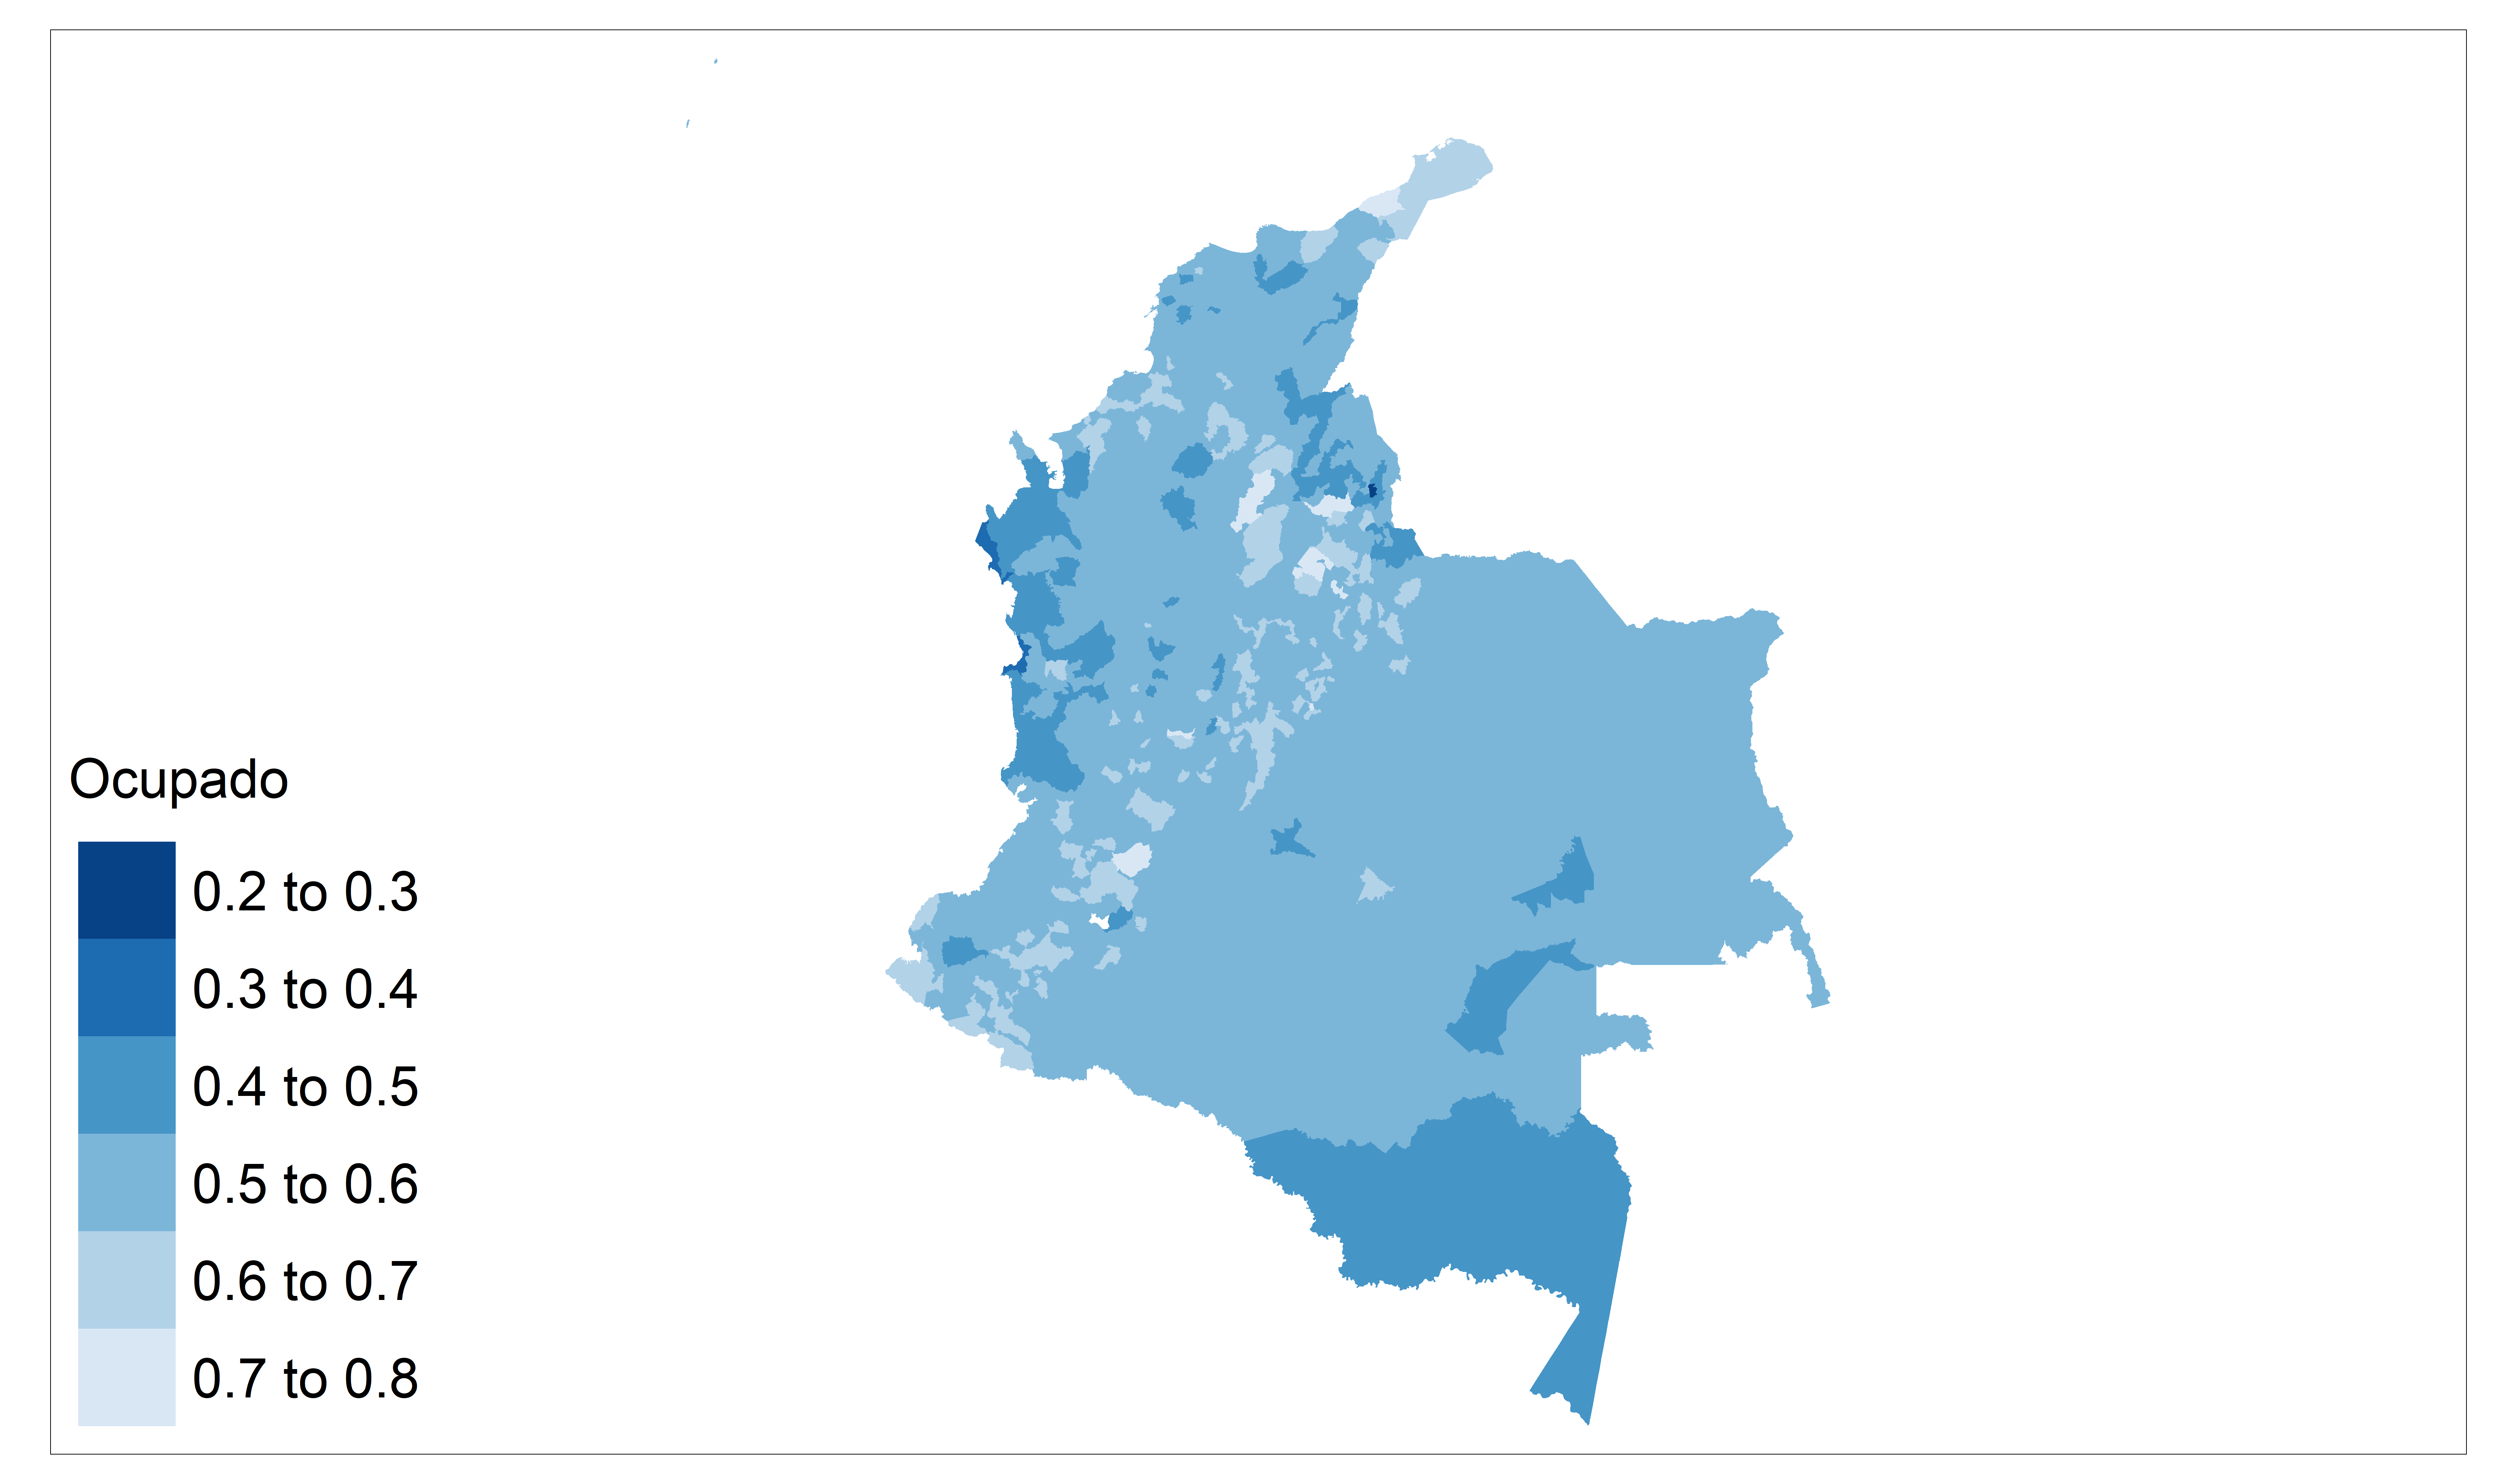
8.6 Mapas del mercado de trabajo.

library(sp)
library(sf)
library(tmap)
ShapeSAE <- read_sf("01 Modelo de area/COL/2018/ShapeDeptoCOL/COL_dam2.shp")

P1_empleo <- tm_shape(ShapeSAE %>%
                           inner_join(estimaciones))
brks_ocupado <- seq(0.2,0.8,0.1)
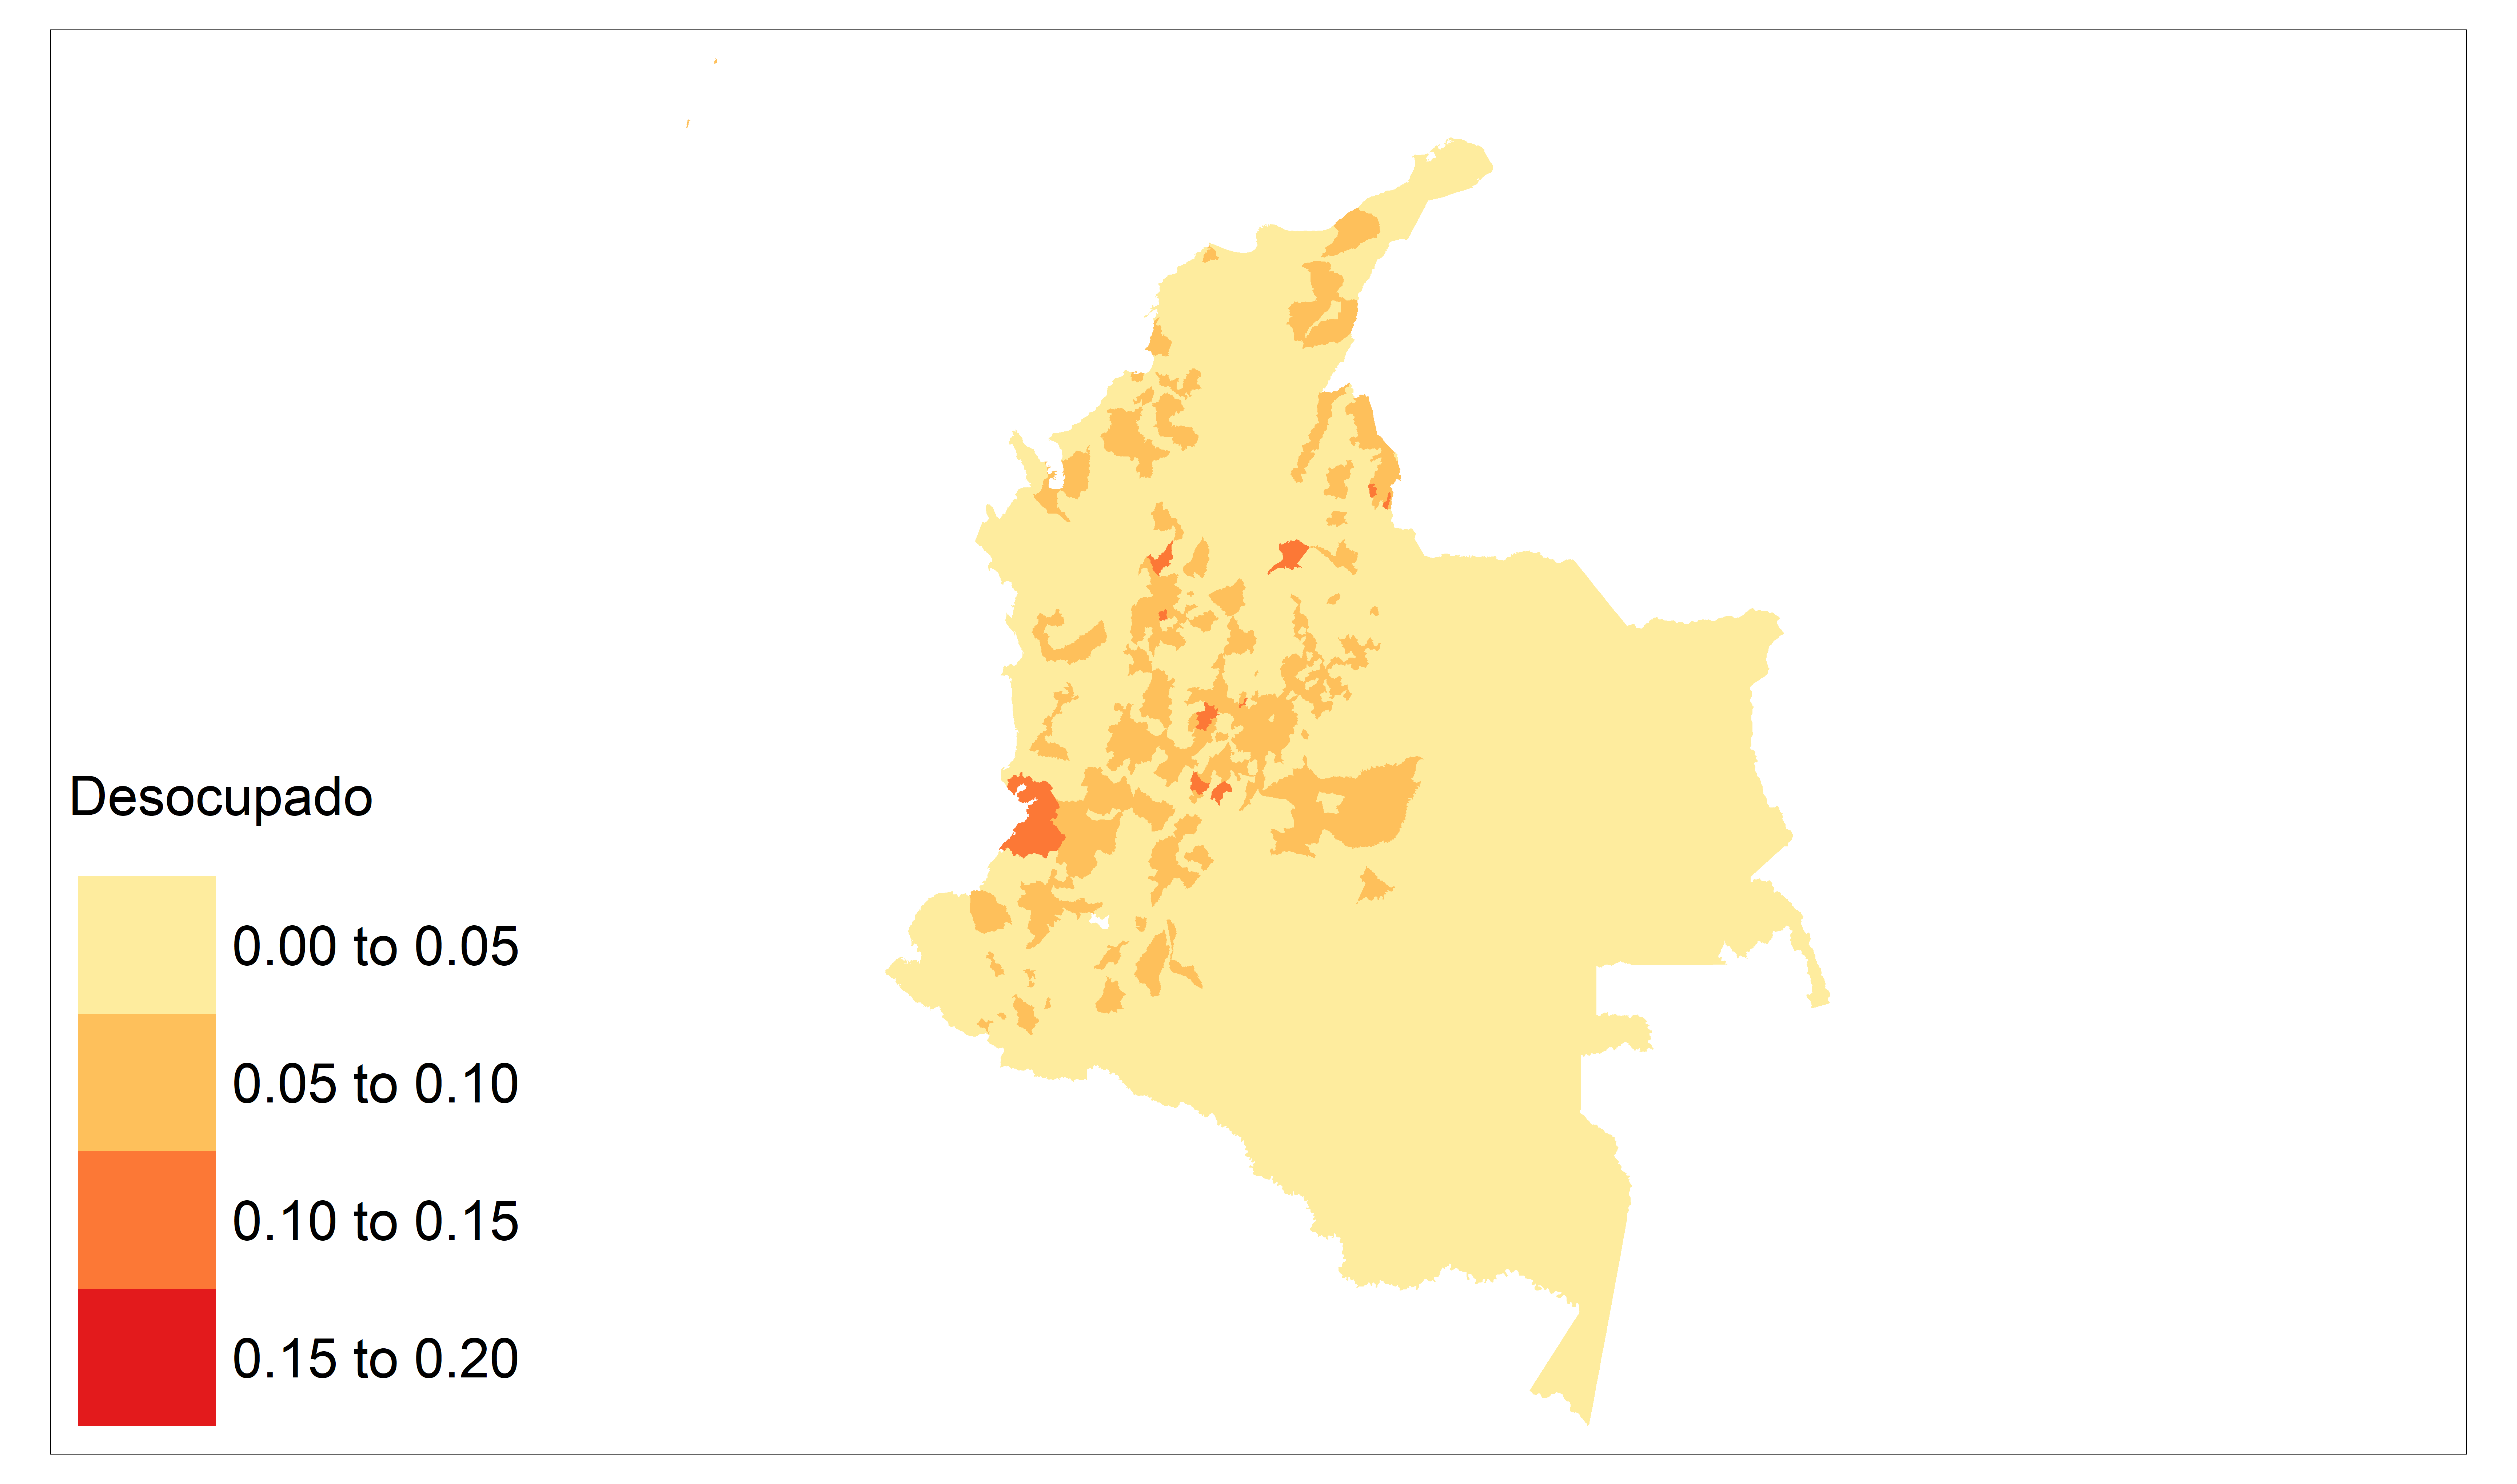
brks_desocupado <- seq(0,0.2,0.05)
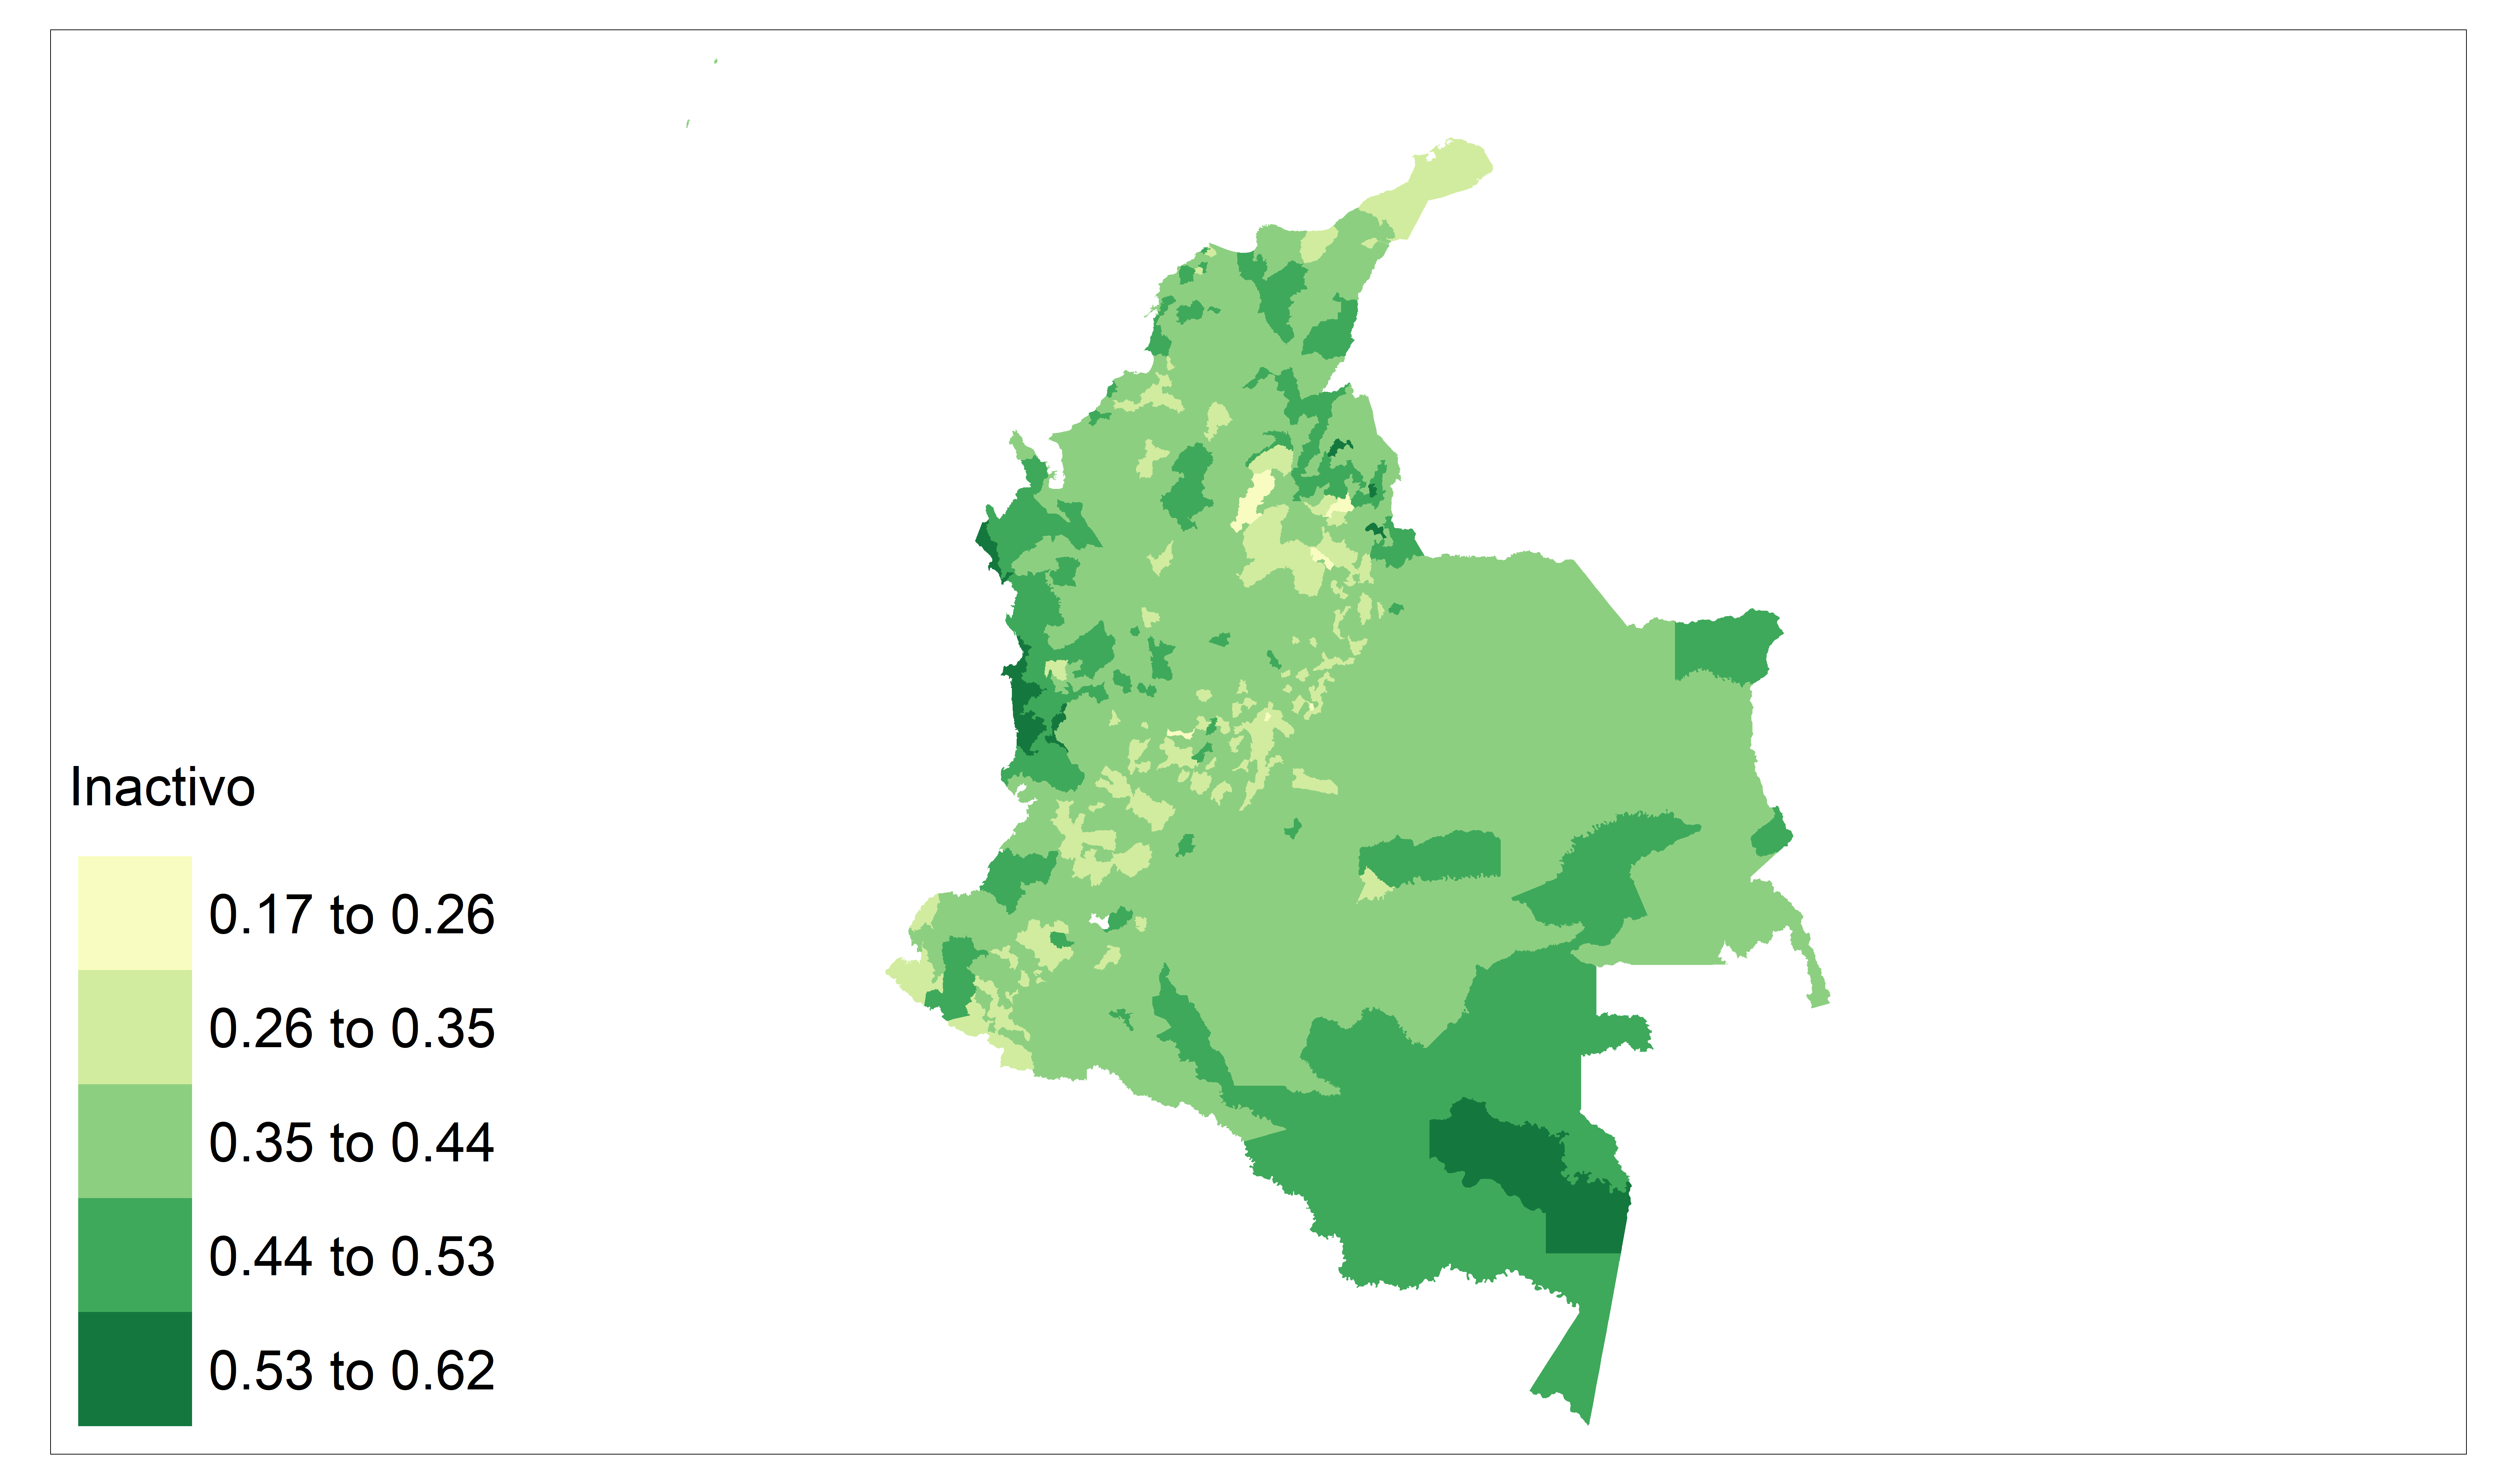
brks_inactivo <- seq(0.17,0.62, 0.09)

Ocupado

Mapa_ocupado <-
  P1_empleo +
  tm_fill("Ocupado_Bench",
          breaks = brks_ocupado,
          title = "Ocupado",
          palette = "-Blues") +
  tm_layout(
    legend.only = FALSE,
    legend.height = -0.5,
    legend.width = -0.5,
    asp = 1.5,
    legend.text.size = 3,
    legend.title.size = 3
  )
Mapa_ocupado

Desocupado

Mapa_desocupado <-
  P1_empleo + tm_fill(
    "Desocupado_Bench",
    breaks = brks_desocupado,
    title =  "Desocupado",
    palette = "YlOrRd"
  ) + tm_layout( 
    legend.only = FALSE,
    legend.height = -0.5,
    legend.width = -0.5,
    asp = 1.5,
    legend.text.size = 3,
    legend.title.size = 3)
Mapa_desocupado

Inactivo

Mapa_Inactivo <-
  P1_empleo + tm_fill(
      "Inactivo_Bench",
    title =  "Inactivo",
    breaks = brks_inactivo,
    palette = "YlGn"
  ) + tm_layout( 
    legend.only = FALSE,
    legend.height = -0.5,
    legend.width = -0.5,
    asp = 1.5,
    legend.text.size = 3,
    legend.title.size = 3)