library(TeachingSampling)1 Surveys and Sampling Studies
Throughout the past century, a series of theories and principles has emerged that offers a unified framework for the design, implementation, and evaluation of surveys. This framework is commonly known as the “total survey error” paradigm and has guided modern research toward better survey quality. Groves et al. (2004)
This introductory chapter seeks to identify the nonmathematical principles of the design, collection, processing, and analysis of sampling studies. These studies have grown over the years, while still facing certain economic and logistical limitations. A sampling study involves professionals from different disciplines who work to reduce costs and improve the quality of estimates. A large area of statistical science is concerned with minimizing sampling errors, while another large area of the social sciences is concerned with minimizing the errors that may occur during data collection.
1.1 Methodological Concepts
Sampling is a procedure that responds to the need for accurate statistical information about a population and the sets of elements that compose it. Sampling deals with partial investigations of the population that aim to infer to the full population. In recent decades it has developed substantially in different fields, mainly in the government sector through the publication of official statistics that make it possible to monitor government goals, as well as in academia, the private sector, and communications. According to Lohr (2000), annual spending on sample surveys in the United States represents 2 to 5 billion dollars. The increased use of sampling techniques in research is understandable because sampling costs much less money, takes less time, and may even be more precise than carrying out a complete enumeration, also called a census. A well-selected sample of a few thousand individuals can represent a population of millions with great precision.
A fundamental requirement of a good sample is that the characteristics of interest that exist in the population be reflected in the sample as closely as possible. To this end, the following concepts must be defined:
- Target population: the complete collection of all units to be studied.
- Sample: a subset of the population.
- Sampling unit: the object selected into the sample that will provide access to the observation unit.
- Observation unit: the object on which the measurement is ultimately made.
- Variable of interest: the characteristic of the individuals on which inference is made in order to address the research objectives.
In sampling theory, the variable of interest is not assumed to be a random variable, but rather a fixed quantity or an intrinsic characteristic of the units that compose the population.
1.1.1 Survey
A survey is understood as a statistical investigation with the following characteristics:
- The objective of a survey is to provide information about the finite population and/or about subpopulations of special interest.
- One or more variables of interest are associated with each element of the population. A survey makes it possible to obtain information about unknown population characteristics called parameters. These are functions of the values of the variables of interest, and they are both unknown and required.
- Access to and observation of population elements is established through a sampling algorithm, which is a mechanism that associates the elements of the population with sampling units.
- A sample of elements is selected. This may be done by selecting the observation units in the scheme. A sample is probabilistic if it is selected through a probabilistic mechanism and the selection probability of all possible samples is known.
- The elements selected in the sample are observed and the measurement process is carried out; that is, for each element in the sample, the variable of interest is measured and its values are recorded.
- The recorded values of the variables are used to calculate estimates of the parameters of interest.
- The estimates are finally published. They are used for decision-making.
1.1.1.1 Life Cycle of a Survey
Groves et al. (2004) state that a survey runs from design, through execution, to the delivery of estimates. If a good design is not carried out, there will be no good estimates. Along this path, the researcher must go through the following steps:
- Search for constructs: constructs are the abstract ideas about which the researcher wishes to make inferences. In a victimization survey, the goal is to measure how many crime-related incidents took place in a certain period of time; the researcher must decide what counts as a crime and who counts as a victim. In a quality-of-life survey, the goal is to know how many poor people there are in a given region; therefore, it is necessary to decide what poverty means.
- Measurement: the key issue for good measurement is to design questions that produce answers that perfectly reflect the constructs being measured. For example, in a victimization survey, one might ask: “In the last six months, have you called the police to report something that happened to you and that you consider to be a crime?” On the other hand, in a quality-of-life survey, a poverty indicator may be given in terms of the number of household appliances owned by the household. Thus, one may ask: “How many televisions do you have in your household?” or also “How many electric light bulbs does your household have?”
- Response: the nature of the responses is determined by the nature of the questions. Sometimes the response may be part of the question, with the respondent’s task being to choose among the categories asked; at other times, the respondent generates a concrete answer in their own words.
- Editing: logical relationships exist among the questions in a survey. For example, if a respondent declares that she is 12 years old and has given birth to 5 children, there must be an editing process for this individual. This process attempts to detect outliers and review the information in order to obtain the best measure of the intended construct.
- Analysis and delivery of results: the statistical process produces estimates that support decision-making and address the objectives proposed at the beginning of the investigation.
1.1.2 Sampling Frame
Every probability sampling procedure requires a device that makes it possible to identify, select, and locate each and every object belonging to the target population and participating in the random selection. This device is known as a sampling frame. In sampling research, two types of objects are considered:
- Elements: the basic individual units on which the measurement is made.
- Cluster: a grouping of elements whose main characteristic is that they are homogeneous within themselves and heterogeneous among themselves.
When a frame of elements is available, an element sampling design can be applied; in many cases, cluster sampling designs are used even when a frame of elements is available. If no frame of elements is available (or if it is very costly to build one), cluster sampling designs must be used; that is, cluster frames are used. For example, when conducting a survey whose observation unit is the people living in a city, it is very difficult to access a sampling frame of people. However, one may have access to the sociodemographic division of the city and thus select some neighborhoods of the city in a first stage and then select people from those neighborhoods in a second stage. In the preceding example, neighborhoods are a clear example of clusters. These groupings of elements have the characteristic of appearing in the state of nature. Thus, if a frame of elements is available, for example, the list of employees of an entity, it is possible to apply an element sampling design, carry out the random selection, and make the necessary estimates according to that same design. Readers should remember that elements are the entities that compose the population, while sampling units are the entities that make up the sampling frame. When no sampling frame is available, it must be built. There are two types of sampling frames, namely:
- List frames: physical or digital lists, files, case records, and medical records that make it possible to identify and locate the objects that will participate in the random draw.
- Area frames: maps of cities and regions in physical or digital format, aerial photographs, satellite images, or similar materials that make it possible to delimit regions or geographic units so that they can be identified and located in the field.
It is a virtue of the frame if it contains auxiliary information that makes it possible to apply sampling designs and/or estimators that lead to more efficient strategies with respect to the precision of the results. The same is true if the auxiliary information is organized according to desirable orders. Auxiliary information is called discrete if the sampling frame makes it possible to disaggregate the target population into categories or smaller population groups, such as socioeconomic level or industrial group. Auxiliary information is called continuous if there are one or more positive continuous characteristics of interest. It is desirable for continuous auxiliary information to be highly related to the characteristic of interest.
On the other hand, a sampling frame is defective if it presents one or more of the following cases:
- Overcoverage: occurs if the device contains objects that do not belong to the target population. Not all those listed belong there.
- Undercoverage: occurs when some elements of the target population do not appear in the sampling frame or when the entry of new members has not been updated. Not everyone who belongs is listed.
- Duplication: duplication in a sampling frame occurs if the device contains several records for the same object. The most frequent reason for this defect is careless construction of the frame from the union of administrative records from two or more information sources.
These defects cause errors in the calculation of the expressions that will be used to generate the corresponding estimates, producing bias, loss of precision, and, in some cases, a complete loss of validity in the study results.
1.1.2.1 Types of Target Populations
Groves et al. (2004) consider that the types of target populations most frequently encountered in a sampling study are the following:
- Households and persons: the sampling frame most commonly used for these populations is an area frame. Because it is based on geographic areas, this type of frame requires linking households or persons to each of the areas. When people must be selected, this type of frame requires many stages of sampling; in this way, a subset of geographic areas is selected. For each selected area, a subset of sections is selected, then blocks, then households, and finally, within each household, persons are selected; these are the observation units.
- Clients, employees, or members of organizations: list frames are generally used for selecting members of organizations. It is important for the statistician to know how often and how the list is updated, since it may present the three types of defects discussed above.
- Organizations: there are various types of organizations, such as churches, prisons, firms, hospitals, schools, and so on. In surveys of commercial establishments, it is common to have access to list frames that group businesses with great dispersion among them. Thus, one may find anything from a neighborhood store with sales of 1,000 dollars per month to a hypermarket that sells 500 million dollars per month.
- Events: in some cases, the target population consists of events. Many types of events qualify for conducting a survey, including marriages, births, deaths, periods of depression, or the passage of a car along a segment of road. Sampling frames for events are often frames of persons. Thus, a person has either experienced the event or not. In fact, a person may have experienced several events. However, another sampling frame for events may be given by periods of time or space.
- Rare populations: these arise when incidence is very low, for example populations of blind persons or people with a rare disease. Generally, the way to access this type of population is through a sampling frame that contains this population as a subset of elements that can be located.
NoteExample
Suppose that an official government entity in your country is interested in conducting an unemployment survey in order to determine a) how many people currently belong to the labor force, both in the country in question and in its regions or geographic subdivisions, and b) what proportion of them are unemployed. Based on the above, the following aspects are considered for carrying out this study:
- Target population: All persons in Colombia.
- Domains or subgroups of interest: Age groups, gender, occupational groups, and regions of the country.
- Characteristics of interest: Labor force membership and employment status. These take the value one or zero.
- Parameters of interest: Total number of persons belonging to the labor force, total number of unemployed persons, unemployment proportion.
- Sample: A sample is selected from the population with the help of mechanisms for identifying and locating people in the country.
- Observations: Each person included in the sample is visited by a trained interviewer, who asks questions following a standardized questionnaire and collects the responses in an appropriate instrument.
- Processing: The data are edited and prepared for the estimation stage.
- Estimation: Estimates of the parameters of interest are calculated, together with indicators of the uncertainty of these estimates.
1.1.3 Bias
During the design and implementation of a survey, certain situations may arise that can bias the final estimates. These types of bias may occur before, during, and after data collection. It is the statistician’s task to warn about all possible instances of the problems that cause bias and to ensure that, at every stage of the survey, human error and statistical error are minimized so that, in the end, the study results are as reliable as possible.
1.1.3.1 Selection Bias
This type of bias occurs when part of the target population is not in the sampling frame. A convenience sample is biased because the units that are easiest to choose or most likely to respond to the survey are not representative of the units that are more difficult to choose. (Lohr 2000) states that this type of bias occurs if:
- The selection of the sample depends on a certain characteristic associated with the properties of interest. For example: the frequency with which adolescents talk with their parents about AIDS.
- The sample is selected deliberately or through subjective judgment. For example, if the parameter of interest is the average amount spent on purchases in a shopping center and the interviewer chooses people who leave with many packages, then the information would be biased because it would not reflect average purchasing behavior.
- There are errors in the specification of the target population. For example, in electoral surveys, this happens when the target population includes persons who are not registered to vote with their country’s electoral organization.
- There is deliberate substitution of unavailable units in the sample. If, for some reason, it was not possible to obtain the measurement and consequent observation of the characteristic of interest for some individual in the population, the substitution of this element must be done under strict statistical procedures and must not be subjective in any way.
- There is nonresponse. This phenomenon can distort results when those who do not respond to the survey differ critically from those who did respond.
- The sample is composed of volunteer respondents. Radio forums, television surveys, and internet portal studies do not provide reliable information.
1.1.3.2 Measurement Bias
This type of bias occurs when the instrument used to carry out the measurement tends to differ from the true value one wishes to ascertain. This bias must be considered and minimized at the survey design stage. Note that no statistical analysis can reveal that a scale added 2 kg to every person in a health study. (Lohr 2000) cites some situations in which this measurement bias occurs:
- When the respondent lies. This situation often occurs in surveys that ask about wage income, alcoholism and drug addiction, socioeconomic level, and even age.
- Questions are difficult to understand. For example: Do you not think that this is not a good time to invest? The double negative in the question is very confusing for the respondent.
- People tend to forget. It is well known that bad experiences are often forgotten; this situation must be bounded when working on a crime survey.
- Different answers are given to different interviewers. In some regions, the race, age, or gender of the interviewer is very likely to directly affect the respondent’s answer.
- Reading the questions incorrectly or arguing with the respondent. The interviewer can strongly influence the answers. For this reason, it is very important that the interviewer training process be rigorous and complete.
- The sample is composed of volunteer respondents. Radio forums, television surveys, and internet portal studies do not provide reliable information.
1.2 Marco and Lucy
This book uses as its application base a government investigation that seeks to address the objective of measuring economic growth in the industrial sector.
Suppose that, in order to meet this objective, it has been proposed to conduct a survey of firms that are part of the industrial sector, in order to understand the behavior of the sector in terms of financial, social, and fiscal constructs. Once the measurement process is complete, estimates can be calculated and indicators can be constructed that make it possible to infer about the sector’s growth during the period of interest.
The target population consists of all firms whose main activity is linked to the industrial sector. The measurement process will be based on the characteristics of interest, namely: income in the last fiscal year, taxes declared in the last fiscal year, and number of employees. In addition, it is necessary to know whether the firm periodically sends some type of advertising material by email, because it is suspected that firms obtain higher income when they use this advertising strategy, which is favorable for the government because it increases tax contributions and job creation.
To obtain the answers, an interviewer will visit the firm’s physical facilities and ask the following questions:
- In the last fiscal year, how much income did this firm receive?
- In the last fiscal year, how much tax did this firm declare?
- Currently, how many employees work for this firm?
- Does this firm usually send advertising material periodically by email to its customers or potential customers?
It is known that the population size is 2,396 firms. Depending on the sampling strategy to be used and on the quality of the sampling frame, the sampling units may be the firms themselves.
To address the selection of a sample that allows inference about the economic growth of the sector, a sampling frame is available with the following characteristics for each firm in the population.
Identifier: an alphanumeric sequence of two letters and three digits. This identification number is assigned to each firm at the time of legal incorporation before the relevant registration entity.
Location: the address registered in the tax return.
Zone: the city consists of neighborhoods or geographic zones. Depending on the address, the firm belongs to one and only one geographic zone of the city.
Level: according to tax records, firms are classified into three groups:
Large: firms that pay 49 million dollars per year or more in taxes.
Medium-sized: firms that pay more than 11 million and less than 49 million dollars per year in taxes.
Small: firms that pay 11 million dollars per year or less in taxes.
Note that a firm can belong to only one industrial level.
1.2.0.1 Visualization in R
The R package TeachingSampling includes two data files. The sampling frame called Marco, from which a random sample of firms to be interviewed will be drawn, contains the identification, location, zone, and level of each firm in the industrial sector. On the other hand, it includes the data set called BigLucy, which contains the values of the characteristics of interest for all elements of the population.
To access the two data sets, it is necessary to load the package in the R environment. The TeachingSampling package can be loaded easily using the following instruction:
Once the TeachingSampling package has been loaded, the sampling frame is displayed as follows:
data(BigLucy)
BigLucy[1:10, c(1:4, 11)]
ID Ubication Level Zone Segments
1 AB0000000001 C0212063K0089834 Small County1 County1 1
2 AB0000000002 C0011268K0290629 Small County1 County1 1
3 AB0000000003 C0077703K0224194 Small County1 County1 1
4 AB0000000004 C0091012K0210885 Small County1 County1 1
5 AB0000000005 C0301070K0000827 Small County1 County1 1
6 AB0000000006 C0255289K0046608 Small County1 County1 1
7 AB0000000007 C0280547K0021350 Small County1 County1 1
8 AB0000000008 C0148379K0153518 Small County1 County1 1
9 AB0000000009 C0111156K0190741 Small County1 County1 1
10 AB0000000010 C0199974K0101923 Small County1 County1 1The instruction BigLucy[1:10,c(1:4,11)] is used to show the first ten firms in the sampling frame. If the entire data set is to be displayed, the instruction BigLucy will show the whole sampling frame. The names function shows each of the objects that make up the data file, while the dim function shows the dimensions of the data set.
names(BigLucy) [1] "ID" "Ubication" "Level" "Zone" "Income" "Employees"
[7] "Taxes" "SPAM" "ISO" "Years" "Segments" dim(BigLucy)[1] 85296 11The data file is read as follows: taking row number 3 (the third firm in the data set) as a reference, this is a firm whose identification number is AB0000000001, located at the address C0212063K0089834, with industrial level Small, located in zone County1 and in segment County1 1. This firm recorded net income of 281 million dollars in the last fiscal year and paid taxes of 3 million dollars. It currently employs 41 employees, does not periodically send advertising to its customers or potential customers by email, does not have ISO quality certification, and has been in operation for 14 years.
BigLucy[1:10, 5:10] Income Employees Taxes SPAM ISO Years
1 281 41 3.0 no no 14.0
2 329 19 4.0 yes no 17.6
3 405 68 7.0 no no 13.6
4 360 89 5.0 no no 44.7
5 391 91 7.0 yes no 23.3
6 296 89 3.0 no no 48.3
7 490 22 10.5 yes yes 17.0
8 473 57 10.0 yes no 7.5
9 350 84 5.0 yes no 38.7
10 361 25 5.0 no no 18.3Note that the population data set BigLucy contains the value of the characteristics of interest for each firm. Up to this point, no sample has been selected; however, if one hypothetically assumes that the selected sample had been the first ten firms in the sampling frame, the database after measurement would look like the output shown above, and with these data the required estimates would be made in order to meet the research objectives.
The statistics concerning the variables in the population are easily displayed with the summary function applied to the Lucy data set.
summary(BigLucy[, 5:10]) Income Employees Taxes SPAM ISO
Min. : 1 Min. : 1.0 Min. : 0.5 no :33355 no :56896
1st Qu.: 230 1st Qu.: 38.0 1st Qu.: 2.0 yes:51941 yes:28400
Median : 388 Median : 62.0 Median : 6.0
Mean : 430 Mean : 63.2 Mean : 11.8
3rd Qu.: 570 3rd Qu.: 84.0 3rd Qu.: 15.0
Max. :2510 Max. :263.0 Max. :305.0
Years
Min. : 1.0
1st Qu.:13.1
Median :25.4
Mean :25.4
3rd Qu.:37.7
Max. :50.0 Through the total function, we have access to the total of the three characteristics of interest.
total <- function(x) {
  length(x) * mean(x)
}

total(BigLucy$Income)
[1] 36634733total(BigLucy$Employees)[1] 5391992total(BigLucy$Taxes)[1] 1008426The industrial sector has high income amounting to 36634733 million dollars, contributes 1008426 million dollars to the government in tax payments, and employs a total of 5391992 people. The tapply function makes it possible to apply the total function and the mean function to calculate the total and average, respectively, of the variables of interest in each category of the Level variable. The table function counts the total number of cases for one or more categorical variables.
tapply(BigLucy$Income, BigLucy$Level, total) Big Medium Small
3629710 17057285 15947738 table(BigLucy$SPAM, BigLucy$Level)
        Big Medium Small
  no    910  10185 22260
  yes  1995  15610 34336
Note that most income in the industrial sector is earned by medium-sized and small firms. However, on average, large firms double the income of medium-sized firms, which in turn have three times the income of small firms. In absolute terms, the advertising strategy of sending SPAM to customers or potential customers is implemented more frequently among small firms.
The xtabs function makes it possible to create a cross-tabulation between the categorical variables Level and SPAM in the database. The cell values indicate the total of the Income variable. Note that the income of firms that use SPAM as an advertising strategy doubles the income of firms that do not use SPAM in almost all industrial levels.
xtabs(Income ~ Level + SPAM, data = BigLucy) SPAM
Level no yes
Big 1116990 2512720
Medium 6679820 10377465
Small 6288497 9659241The boxplot function makes it possible to produce the boxplot for each of the variables of interest. Note that, with the exception of the Years variable, there is a marked dependence between the behavior of the quantitative characteristics and the industrial level.
p1 <- qplot(Level, Income, data = BigLucy, geom = c("boxplot"))
p2 <- qplot(Level, Employees, data = BigLucy, geom = c("boxplot"))
p3 <- qplot(Level, Taxes, data = BigLucy, geom = c("boxplot"))
p4 <- qplot(Level, Years, data = BigLucy, geom = c("boxplot"))
grid.arrange(p1, p2, p3, p4, ncol = 2)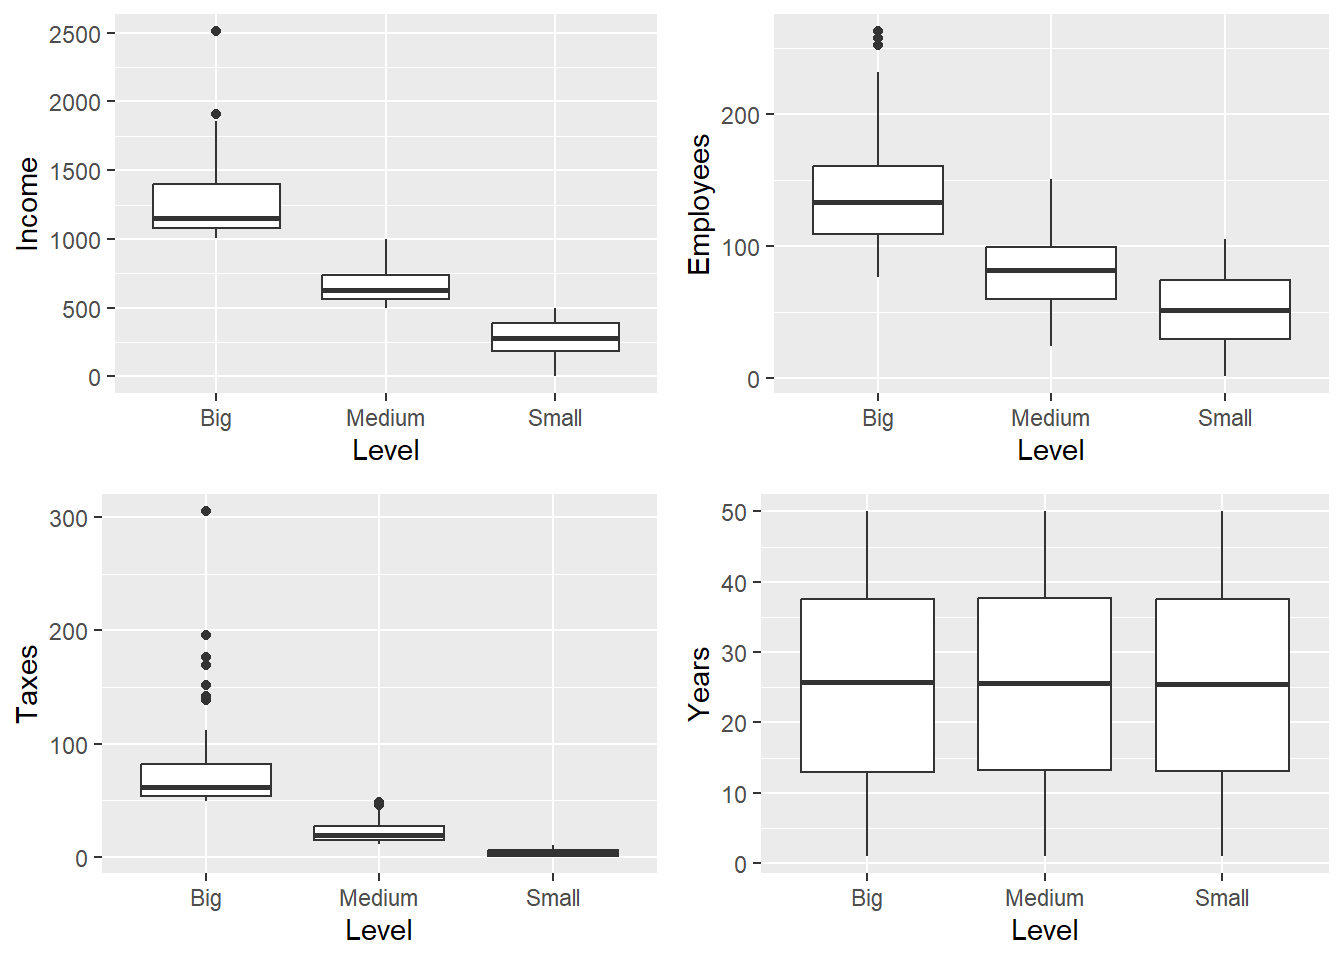
However, unlike the previous case, there does not appear to be a dependence between the behavior of the quantitative characteristics and the habit of sending advertising over the internet.
p1 <- qplot(SPAM, Income, data = BigLucy, geom = c("boxplot"))
p2 <- qplot(SPAM, Employees, data = BigLucy, geom = c("boxplot"))
p3 <- qplot(SPAM, Taxes, data = BigLucy, geom = c("boxplot"))
p4 <- qplot(SPAM, Years, data = BigLucy, geom = c("boxplot"))
grid.arrange(p1, p2, p3, p4, ncol = 2)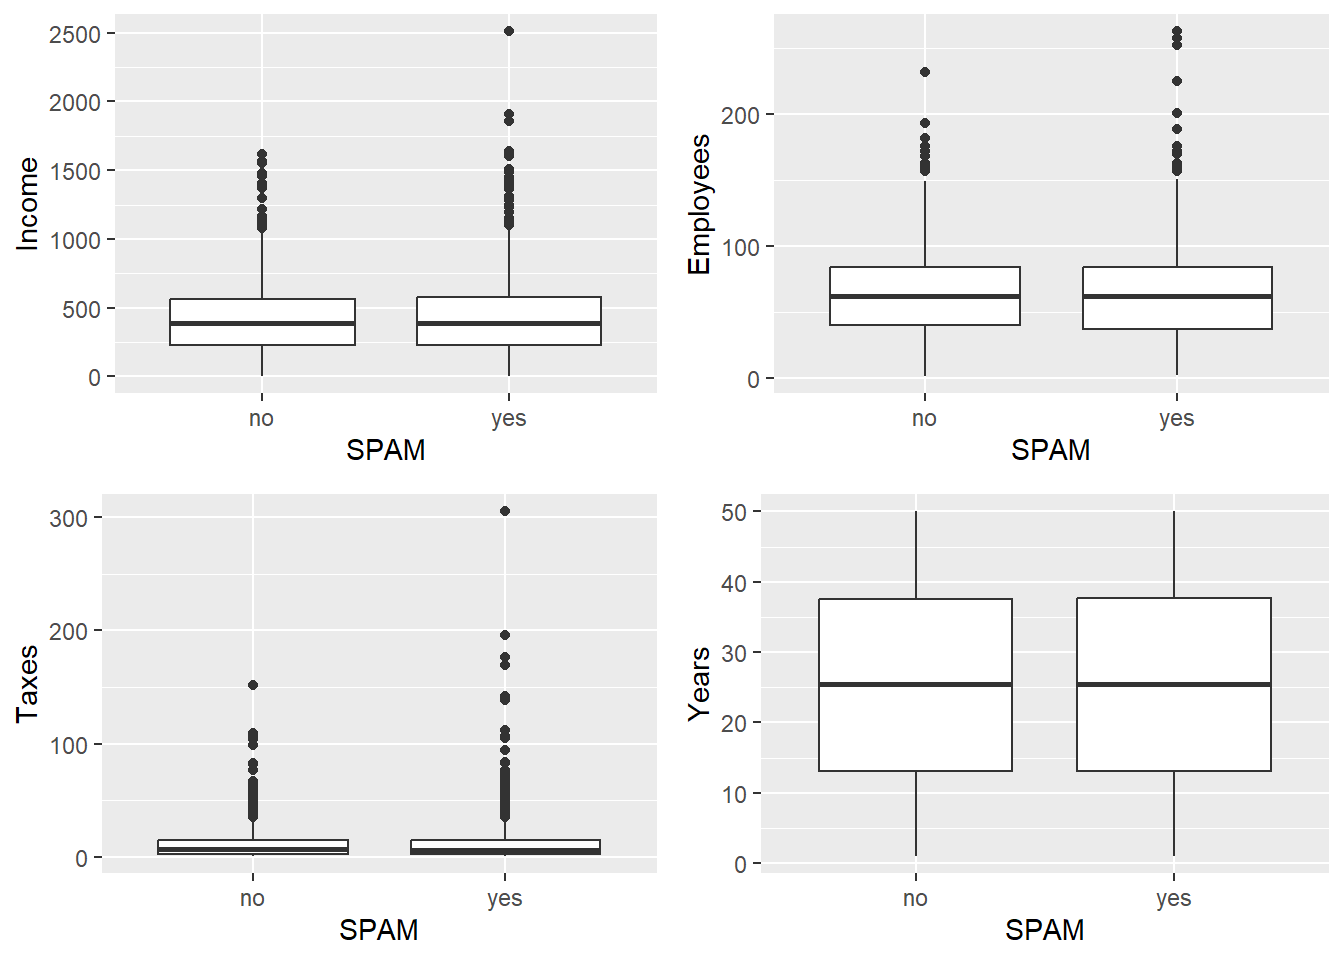
figure 1.1 and figure 1.2 show the dispersion and location of the characteristics of interest by each industrial level. In general, large firms have higher income, contribute a higher tax burden, and employ more people than medium-sized and small firms. It is desirable for the sampling frame to contain each firm’s membership in the industrial level within the population because this is a good discriminator and allows the implementation of appropriate sampling strategies that lead to more precise estimates.
p1 <- qplot(Income, data = BigLucy, geom = c("histogram"))
p2 <- qplot(Employees, data = BigLucy, geom = c("histogram"))
p3 <- qplot(Taxes, data = BigLucy, geom = c("histogram"))
p4 <- qplot(Years, data = BigLucy, geom = c("histogram"))
grid.arrange(p1, p2, p3, p4, ncol = 2)
p1 <- qplot(Income, data = BigLucy, geom = c("histogram"))
p2 <- qplot(Employees, data = BigLucy, geom = c("histogram"))
p3 <- qplot(Taxes, data = BigLucy, geom = c("histogram"))
p4 <- qplot(Years, data = BigLucy, geom = c("histogram"))
grid.arrange(p1, p2, p3, p4, ncol = 2)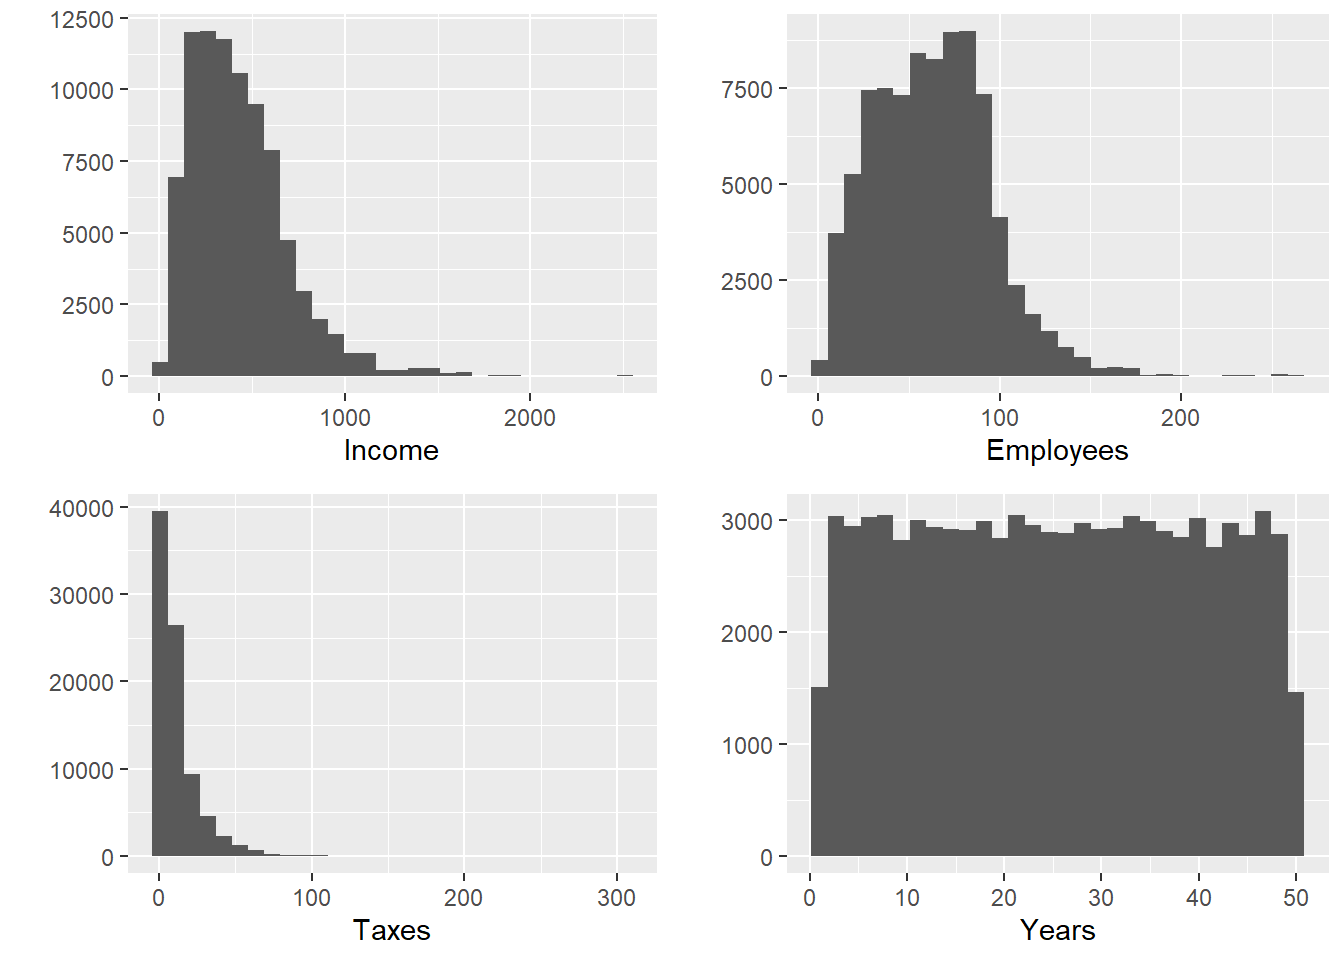
figure 1.3 shows that the distribution of the characteristics of interest is not symmetric and is skewed to the left. These particular features must be taken into account when choosing the best sampling strategy. The hist function makes it possible to create histograms, and the pie function makes it possible to create a pie chart.
The linear correlation among the characteristics of interest is high; between Income and Taxes there is a correlation of 0.91. This can be explained by the fact that firms pay a larger amount of taxes if they have obtained higher income, and vice versa. The cor function is used to obtain the correlation matrix among the characteristics of interest.
analysis_data <- data.frame(
  Income = BigLucy$Income,
  Employees = BigLucy$Employees,
  Taxes = BigLucy$Taxes,
  Years = BigLucy$Years
)
cor(analysis_data)
Income Employees Taxes Years
Income 1.0000000 0.643304 0.9166732 -0.0001266
Employees 0.6433037 1.000000 0.6448609 0.0039724
Taxes 0.9166732 0.644861 1.0000000 0.0008152
Years -0.0001266 0.003972 0.0008152 1.0000000To visualize the relationship among the variables of interest, the pairs function is used to obtain scatterplots for each pair of variables, just as shown in Figure 1.4.
library(GGally)
ggpairs(analysis_data)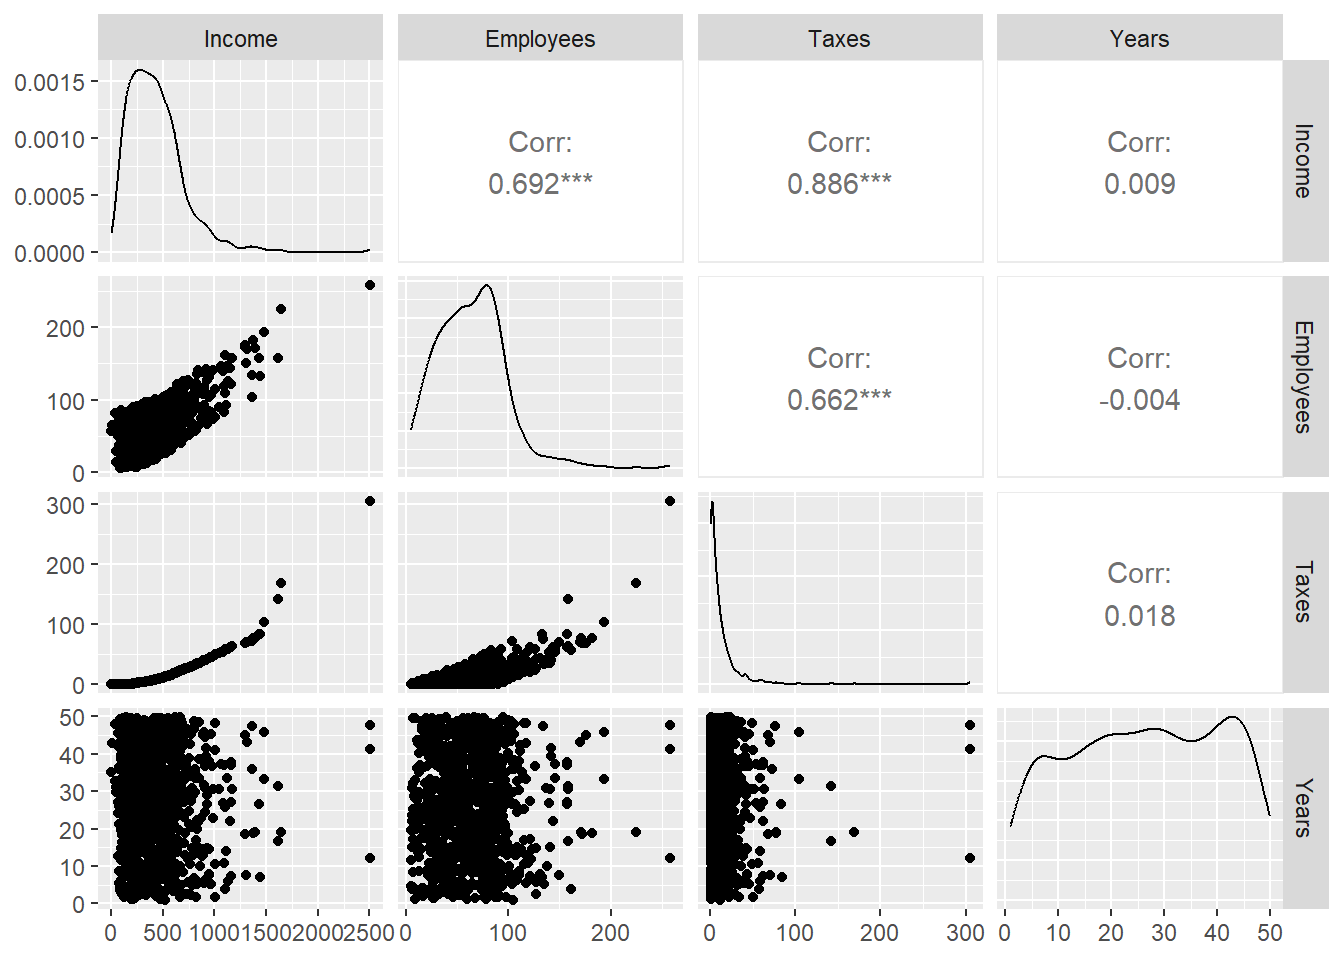
Table 1.1 summarizes the parameters of interest that, through an appropriate sampling strategy, must be estimated in order to address the main objective of the investigation. If estimates broken down by industrial level are desired, then Table 1.2 gives the value of these parameters within the population subgroups.
Consequently, if estimates broken down by advertising behavior are desired, then Table 1.3 shows the value of each of these parameters. Finally, if estimates broken down both by advertising behavior crossed with industrial level are sought, then Table 1.4 summarizes this information.
How to cite this book
Gutiérrez, A. (2027). Sampling strategies: Survey design and parameter estimation. Unpublished version online.
Groves, R. M., F. J. Fowler, M. P. Couper, J. M. Lepkowski, E. Singer, and Tourangeau R. 2004. Survey Methodology. Wiley.
Lohr, S. 2000. Sampling: Design and Analysis. Thompson.